|
|
| ||
Setting Up Inducements
The Inducements Tab allows the experimenter to specify commodity costs or values for each subject, thereby creating market supply and demand curves.
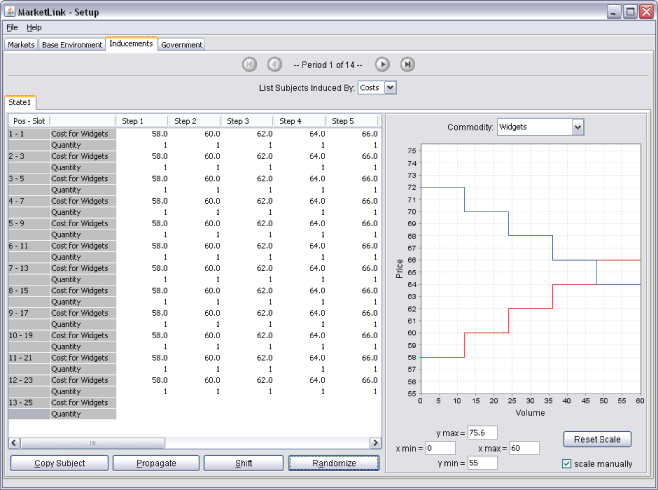
At the top of the screen-shot below, there is a four button panel that allows the experimenter to navigate through all periods. Everything else on the screen displays the inducements for the period displayed only ( i.e. Period 1 of 14 shows the inducements for the first period).

(Click here to open a window image)
- List Subjects Induced By: Choosing "costs" will display sellers in the experiment. Choosing "values" will display buyers in the experiment.
- State Tabs: On the left side of the screen is another set of tabs specific to each state that is defined in the experiment (if no other states have been defined for the experiment, then there will only be one tab here (state 1 is the default).
Under the state tab, there is a spreadsheet defining the position and slot of each subject in the experiment, along with a space to specify the value (or cost) and quantity of a commodity for each step of the subject's demand (or supply) schedule. Values that are put into the schedule are plotted on the right side of the screen.
To input an inducement for different subjects in the experiment, simply click on the box of the spreadsheet under each step and specify the exact amount of the inducement (values for buyers, costs for sellers) along with the quantity of units that are to be induced at that amount. The experimenter may enter inducements for up to 15 steps. The screen-shot above has five steps for each subject where they only sell one unit per step. The cost(value) for each step can be changed as well as the quantity for each buyer.
*Steps must contain cost (values) in ascending (descending) order.
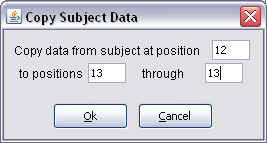
- Copy Subject: Suppose you want to keep the equilibrium price the same regardless of market size. You can acheive this by keeping an equal number of buyers and sellers and by inducing all sellers (buyers) with identical costs (values) for each step. Clicking on this button allows the experimenter to copy the inducement schedule of one subject to that of other subjects. Note: you may have to increase the market size using the Base Environment Tab to copy a subject. In the screen-shot above we can copy the inducements of the 12th seller for the 13th seller.

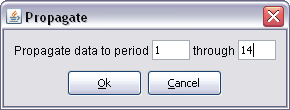
- Propogate: clicking on this button allows the experimenter to copy the entire inducement schedule of all subjects in the currently displayed period to other periods in the experiment.

- Shift: clicking the shift button allows the experimenter to shift the entire inducement schedule in the current period upward or downward by a certain amount. For example, entering a "10" for a shift value when buyers are displayed in the inducement schedule, will cause the demand schedule to shift upwards by 10 for the currently displayed period.
- Randomize: clicking this button will allow the experimenter to specify a base value and a deviation that will be used to randomize inducements for all sellers (if inducement by costs are displayed) or all buyers (if inducement by values are displayed) in the current period.
You can set (or reset) the scale of the supply and demand graphs to "eyeball" the graph you want setup.
- Scale Manually: checking this box will cause the graph to be rescaled to the experimenter's specifications which are entered in the 4 scale boxes (y max, x max, y min, and x min).
- Reset Scale: clicking on this button will cause a manually entered scale to revert to the default setting.
| Copyright 2006 Experimental Economics Center. All rights reserved. | Send us feedback |


