|
|
| ||
Shifts Shown Graphically
Shifts in the demand curve and/or the supply curve will cause equilibrium to change. In some cases both the equilibrium price and quantity will change as well, and in other cases only one changes. The amount of change can be determined rather easily if only one curve shifts but if both shift, it is sometimes difficult to tell whether either the price or quantity has changed.
Shifts in Supply ONLY

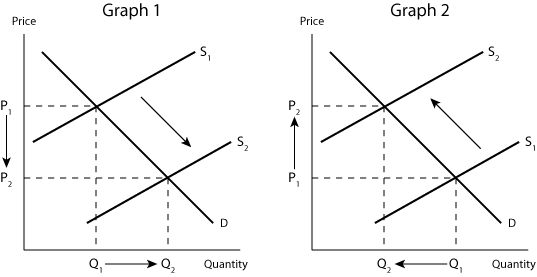
From Graph 1, you can see that an increase in supply will cause the price to decline and the quantity to rise. In Graph 2, supply decreases thus causing an increase in price and a decrease in quantity.
Shifts in Demand ONLY

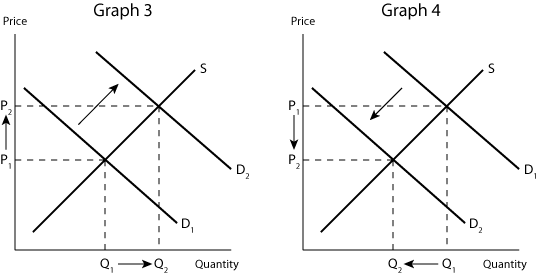
Graph 3 shows an increase in demand resulting in both a higher price and a higher quantity. In Graph 4, demand decreases lowering both the price and quantity.
Shifts in BOTH Supply and Demand

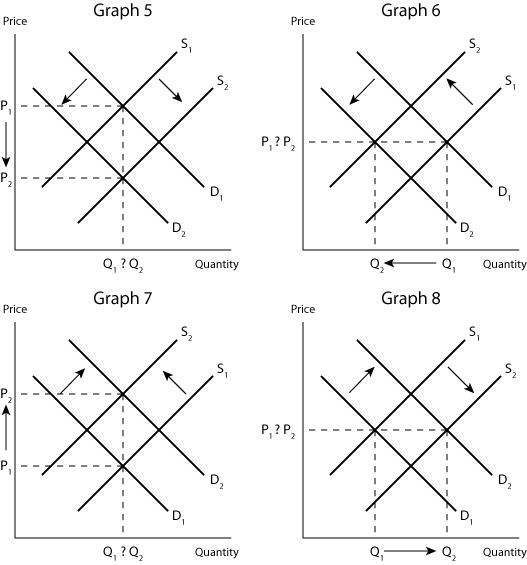
Above it was mentioned that sometimes you will be unable to tell whether price or quantity increases or decreases depending on the shifts in supply and demand. In Graph 5 supply is increased and demand is decreased. In this case, it is easy to see that the price has decreased, but it is hard to tell how the quantity has changed. In Graph 6 both supply and demand are decreased thus decreasing the quantity but leaving it hard to tell if the price has changed. Graph 7 shows a decrease in supply and an increase in demand resulting in an obvious increase in price, but yet again is it hard to determine how the quantity has changed. In Graph 8 both supply and demand are increased also increasing the quantity but leaving the price unable to discern a change. This changes that cannot be seen on these graphs will determine on the amount of the relative shifts in either supply or demand.
| Copyright 2006 Experimental Economics Center. All rights reserved. | Send us feedback |


